
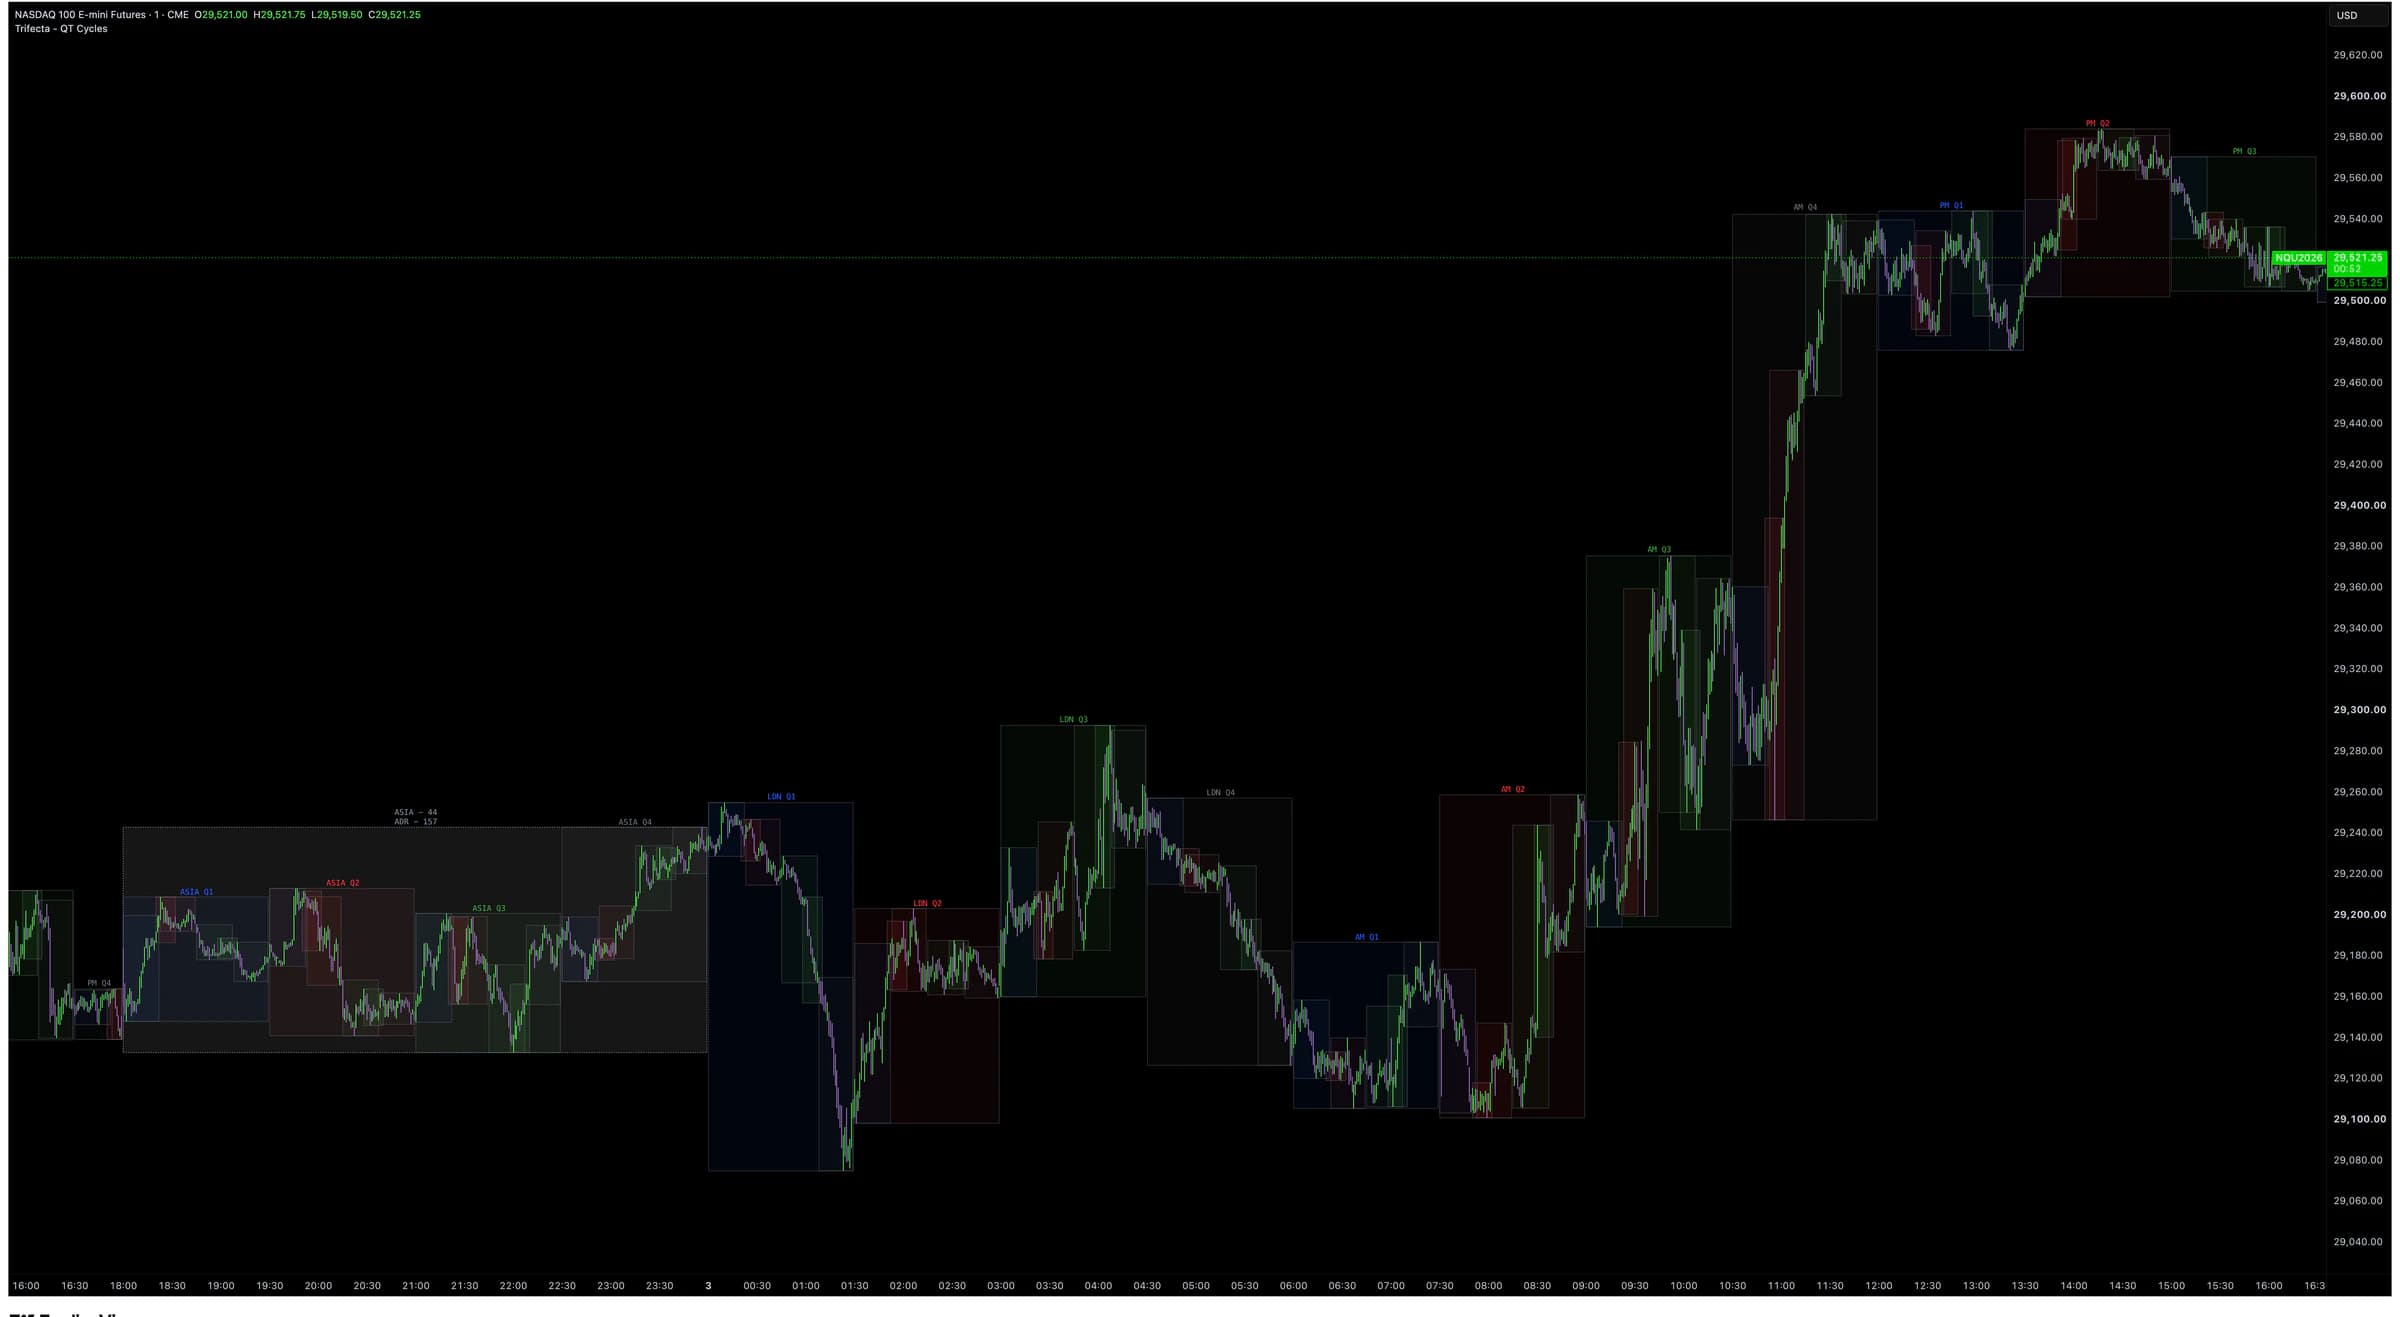
Full QT Cycle Hierarchy
Map the 360M session, 90M quarter, 22.5M micro, 12M inducement, and 5.625M nano cycles together.
Map the complete nested Quarterly Theory cycle hierarchy with prior-cycle levels, Asia context, sweep tracking, and a live dashboard.
Apply a Quarterly Theory lens to recurring time structure. The feature summary below reflects the indicator's current settings, display modes, detection workflow, and alert controls.
Map the 360M session, 90M quarter, 22.5M micro, 12M inducement, and 5.625M nano cycles together.
Choose box or divider rendering independently for the major cycle layers to match your preferred chart density.
Carry forward prior session, quarter, and micro highs and lows, with optional equilibrium references.
Add static or dynamic Asia mapping, optional equilibrium, and average daily range context to the QT framework.
Track completed-cycle liquidity sweeps and inspect the active cycle from a configurable on-chart status table.
Use QT Time Cycles across the market categories supported by the Trifecta toolset.
Access is planned through TradingView’s invite-only indicator system. Final onboarding details will be published before launch.
The feature cards and QT Time Cycles coverage row above summarize the current indicator options verified from the production script.
No. Trifecta provides analytical charting tools, not investment advice or guaranteed outcomes.