
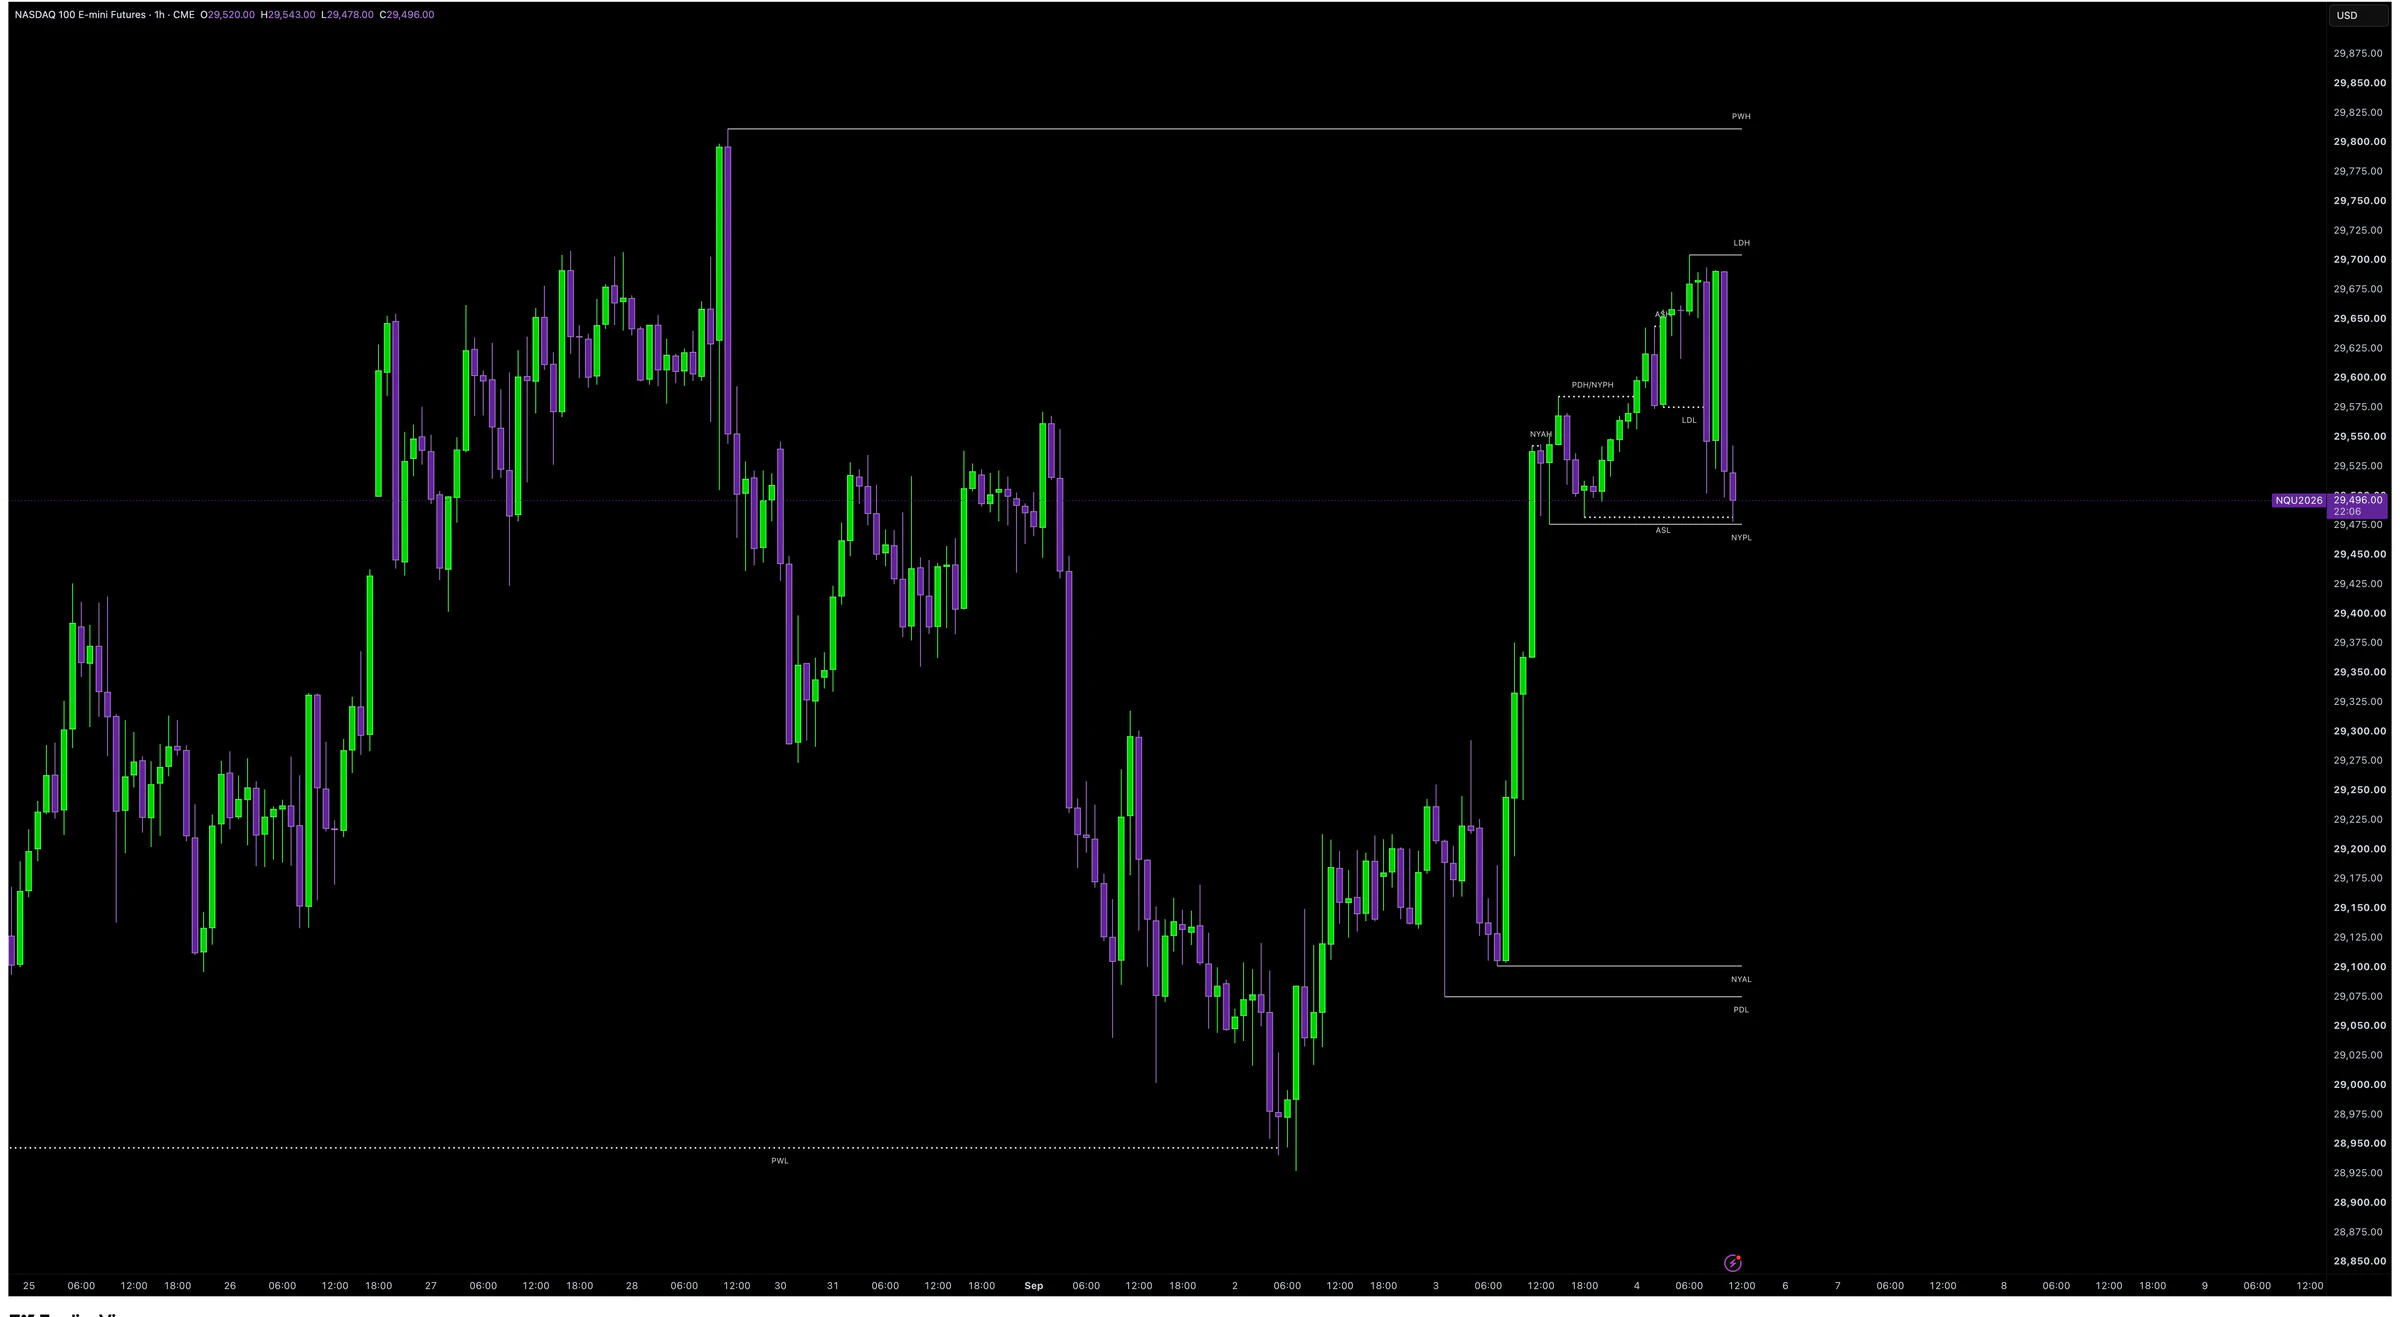
QT-Aligned Liquidity Map
Display previous day, week, month, quarter, and year highs and lows as one higher-timeframe liquidity map.
Combine prior-period liquidity with Quarterly Theory's six-hour session structure and a complete sweep-management workflow.
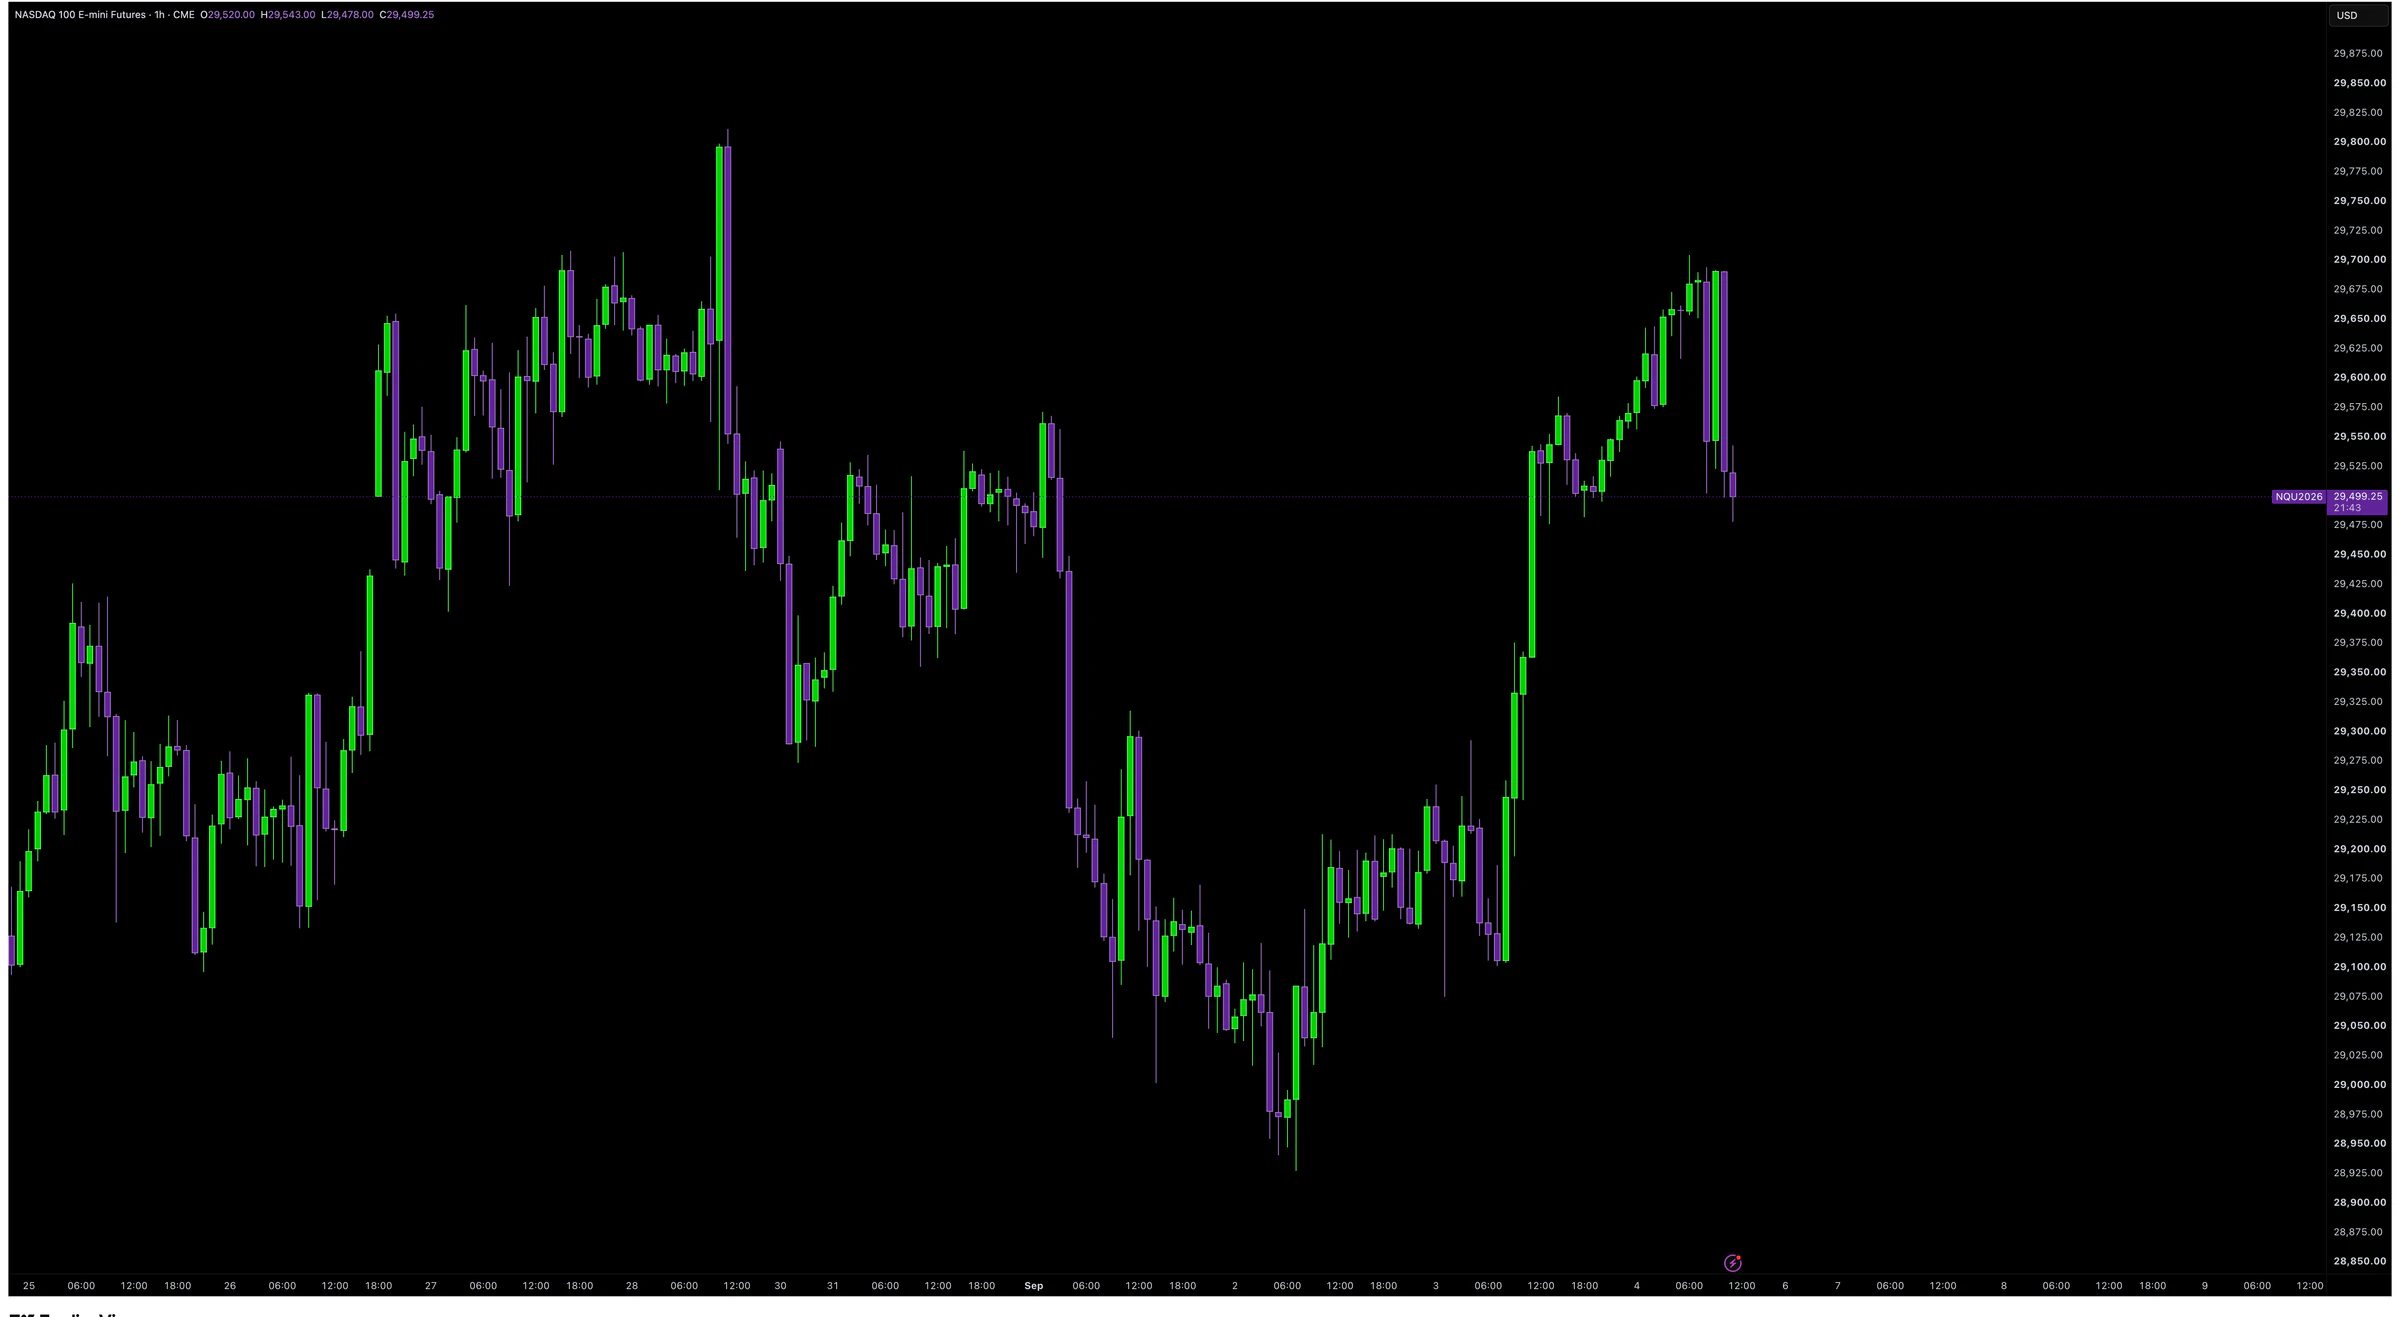
Detect liquidity objectives through a Quarterly Theory framework. The feature summary below reflects the indicator's current settings, display modes, detection workflow, and alert controls.
Display previous day, week, month, quarter, and year highs and lows as one higher-timeframe liquidity map.
Track Asia, London, New York AM, and New York PM using Quarterly Theory's 18:00, 00:00, 06:00, and 12:00 boundaries.
Choose whether swept liquidity stops at the event, remains on the chart as a ghost, or is deleted automatically.
Control high and low notifications separately and enable only the exact higher-timeframe or session scopes you trade.
Configure active, swept, and ghost lines plus scope-specific labels, widths, extensions, and light or dark palettes.
Use QT Liquidity Detection across the market categories supported by the Trifecta toolset.
Access is planned through TradingView’s invite-only indicator system. Final onboarding details will be published before launch.
The feature cards and QT Liquidity Detection coverage row above summarize the current indicator options verified from the production script.
No. Trifecta provides analytical charting tools, not investment advice or guaranteed outcomes.